What are Infographics?
Infographics are a visual representation that includes maps, charts, graphs and diagrams that allow simple, complex concepts to be communicated.
Why use infographics?
- Analysis presentation: helps to better understand the information presented thanks to visual support, schematization, and organization skills.
- Content resource: a good way to explain content and information of the subject or lesson.
- Motivation: Learning becomes more enjoyable and easier
- Social media and learning: infographics create greater participation (interaction) in social networks, increasing the visibility of the message in the online environment.
- We humanize material: content that is more affable and familiar as it is easily understood.
- We help us remember: we have a tendency to recall more what we see than what we hear.
An example of the use of infographics:
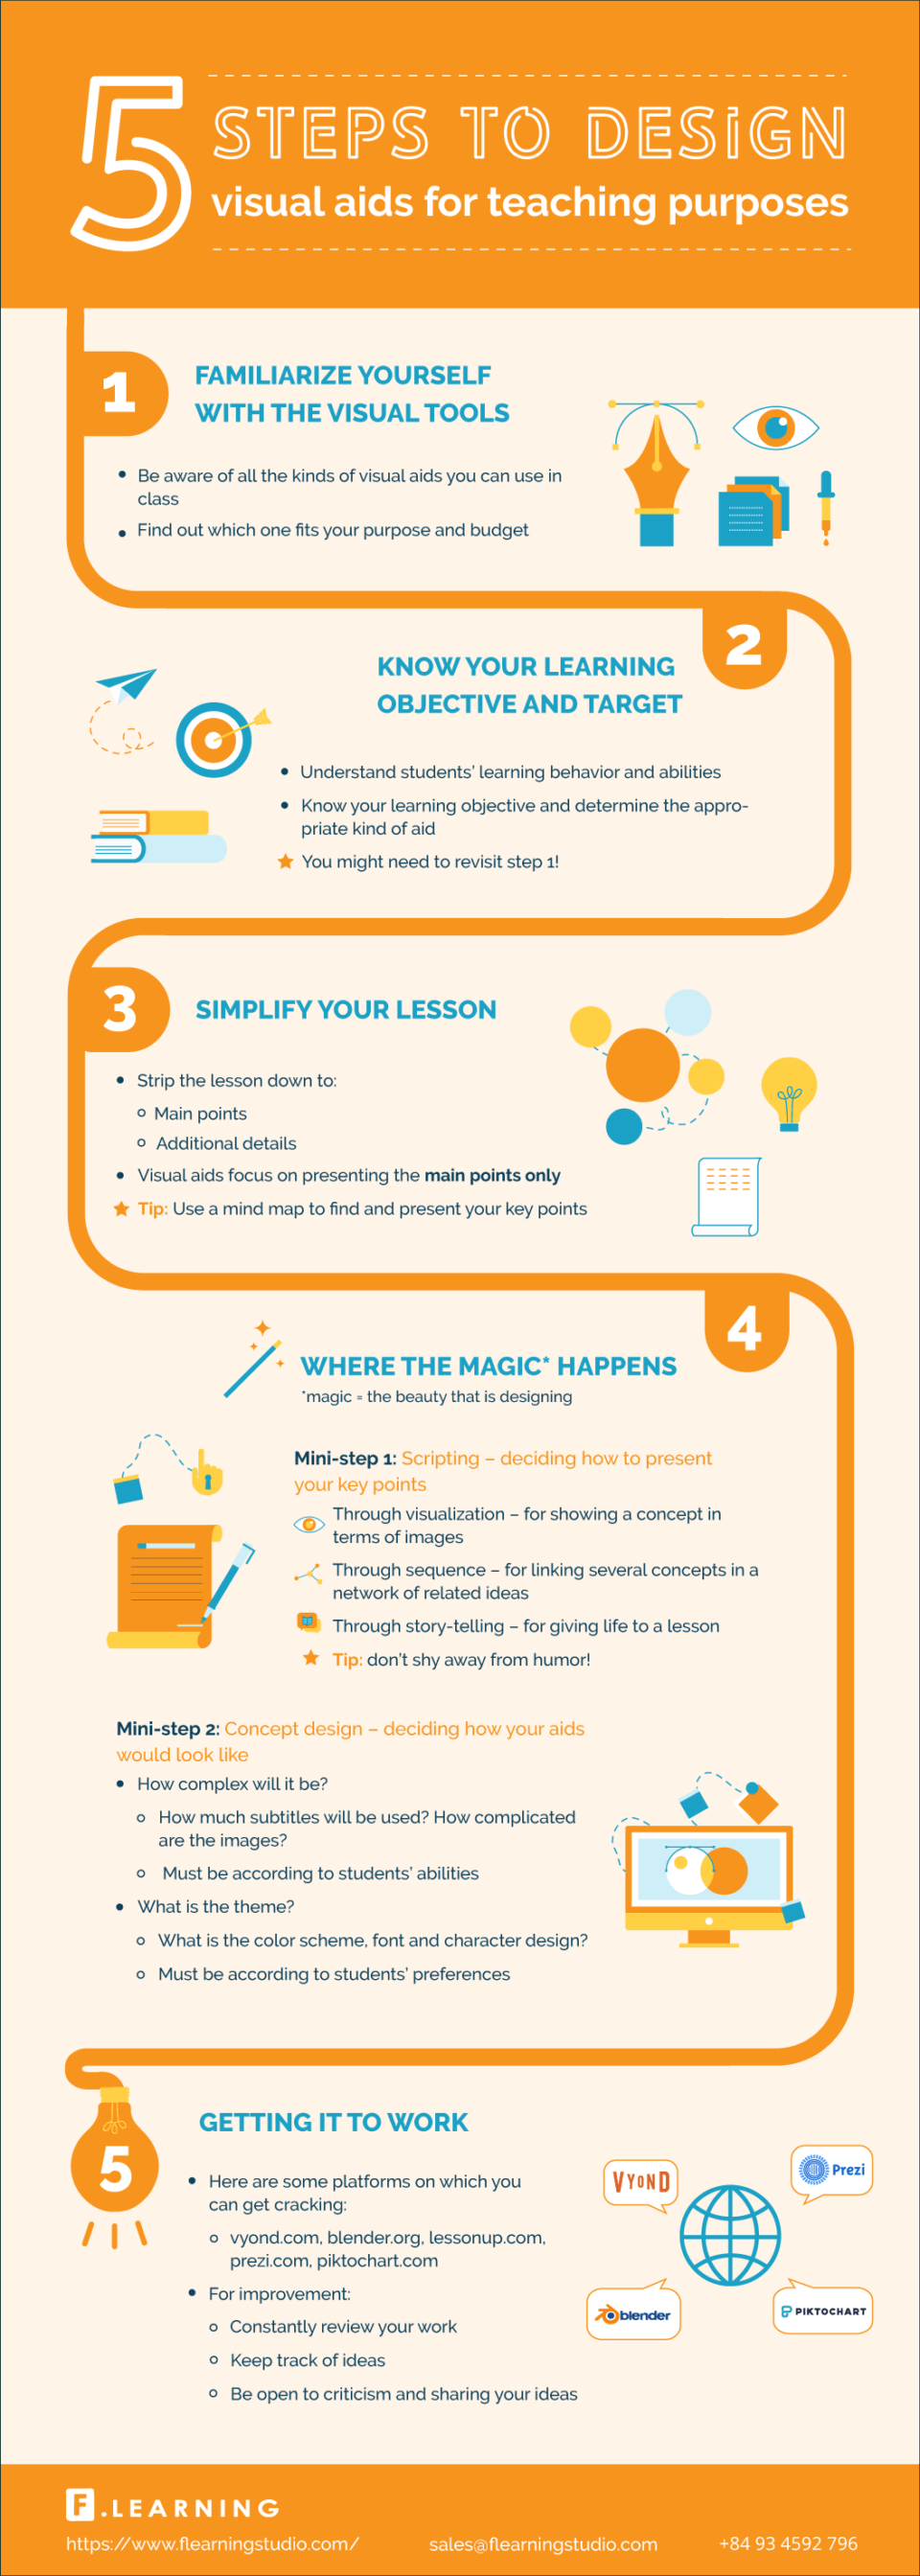 />
/>Retrieved from https://elearninginfographics.com/design-visual-aids-for-teaching-purposes/
Infographic design
Be careful with all these factors while designing your infographics:
- Be creative: copying graphic ideas from other infographics should be avoided.
- Text & Pictures: Graphically, an infographic should be rich avoiding building it with a lot of text.
- Color: Effective contrast colors should be used to encourage reading. An outstanding color selection method is color.adobe.com
- Fonts: An infographic should have a creative use of fonts and letter sizes. The Dafont.com site contains a wide variety of sources that can be used as a reference.
- Icons: An infographic will include basic symbols (icons) in order to communicate properly. The Iconarchive.com site has very good material.
Tools for making infographics
The main free tools for creating infographic elements:
- PiktoChart is a web tool that allows you to create beautiful infographics from a few models and artifacts that are added with a quick drag and drop. It allows you to customize colors and fonts in just a click, being very easy to use. The free option is a bit limited but it allows you to make easy infographics.
How To Create a Piktochart Infographic Easily
- Canva is a software tool that allows people who are not designers to design and create images for the Web. It has free templates to develop infographics easily.
How To Create Infographics (The Ultra-Simple & Easy Way)
No comments:
Post a Comment