Sunday, February 23, 2020

Infographic: visual academic report card

My ePortfolio post: https://userogonzalez.weebly.com/infographic


Visual academic reports


This week we learned how to create infographic. As a former dual-language PreK teacher I was interested in finding the outcomes of English and Spanish language students in HISD enrolled in the HIPPY program.
After following the instructions, I found this report with the outcomes by CIRCLE assessment during 2017-2018.
To create this final image, I used PowerPoint. With the information from the report I edited all the images, especially I modified them with transparency option. To blend the chart with another picture related to this topic I selected a picture from freepik.com (a royalty-free image website).


With the image options I edited the graph colors to make them more prominent and the image from freepik a bit transparent to let the data be read.
To create the image, I copied and pasted the screenshot of the slide 3 to Paint and I saved the image in a JPEG file.

Sunday, February 9, 2020

A picture is worth a thousand words


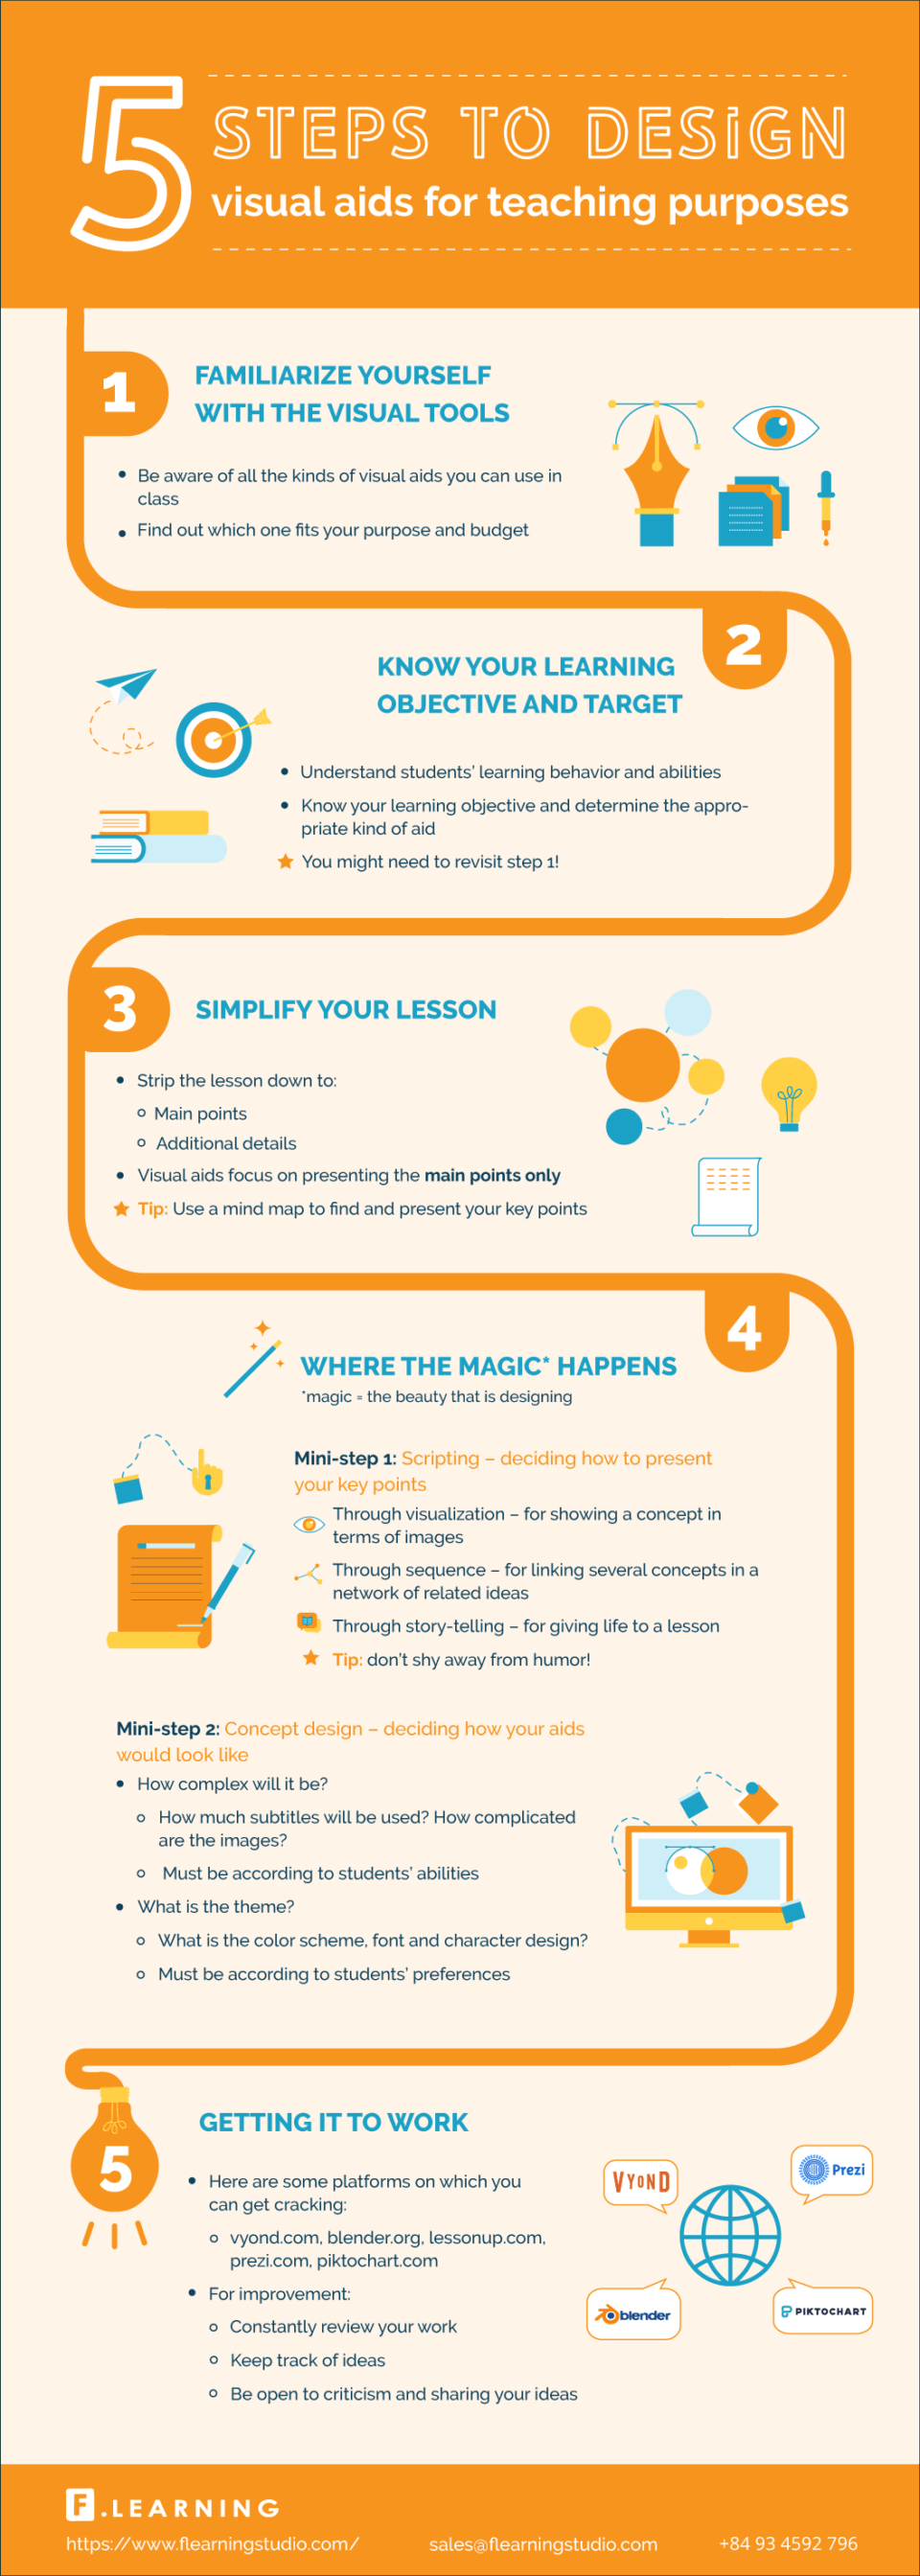
At present, an image, whether fixed or moving, is the fundamental piece of any project where something is meant to be said, even without the text. Such is the importance of the pictures in today's world; and even more its quality!

Image result for how do you say una imagen vale mas que mil palabras in English?
https://icons.iconarchive.com/icons/martin-berube/square-animal/256/Horse-icon.png
   
vs
Image result for horse desert
https://posterfoundry.com/wild-chesnut-draft-horse-running-photo-art-print-poster-12x18/

In this way, the images we take or access from the internet are not the same, beyond their size and resolution. There are many image formats, and all of them have a specific purpose. Although it appears to be the same, an image for a ready-to-print logo is not and can not be the same as a web-prepared image.

Images and digital files

There are file formats that can be manipulated by any sort of editing application and pictures, such as JPG, PNG, GIF, to name a few, that is, we won't need a specific software to be able to use them, as all editing applications have help to be able to work with this type of images.
Related image
https://ignitiondrawing.blog/2018/05/29/what-is-the-difference-between-a-jpg-png-and-gif/

Which one is the best?

In the article Solved - Best Image Format for the Web? PNG, JPG, GIF, and SVG you can read about you the different image formats. Maybe this chart can help you:
https://www.pagecloud.com/blog/web-images-png-vs-jpg-vs-gif-vs-svg


Although there are some applications on the market that can carry out this task, such as the exceptional Gimp, a free and free photo retouching software, the truth is that we always run the risk that the information contained in the PSD file will not be properly interpreted, so we will be facing a safe disaster.

Some recommendations to use images successfully:


  • Catch the attention: with them, you will be able to capture your readers ' attention, entertain them, and eventually get them more interested in your story.
  • Easy reading: you will be able to ease the reading of any of your readers so that the information gathering process is much more enjoyable.
  • Learn and Teach: Thanks to the use of images such as infographics, your readers will be able to capture your article's message much better and apply the information learned much more effectively.
  • Beauty and quality: an article with quality images can make a leap in quality by obtaining a much more professional appearance.
  • Improving Positioning

My favorite image formatting apps:

herramienta imágenes Gimp

Gimp a free software that will allow you to easily retouch your pictures, producing more than satisfactory results. This powerful tool has become an alternative to Photoshop whose number of followers rises day by day.

Among many of its features stand out:

  • pick all types of shapes
  • Smart Scissors for cutting 
  • Error Correction 
  • Editing Tools 
  • Filters 
  • Possibility to export files in all types of formats (jpg, png, gif, svg, etc...)


herramienta para reducir dimensiones de imágenes Pixlr

Pixlr is an online editor whose main goal is to be able to perform simple touch-ups to customize our images in just a couple of seconds.

Pixlr currently has four software to use depending on the interface from which you are accessing them (computer or smartphone)

Digital image banks

- freepik.com - I have a membership
- dreamstime.com
- openphoto.net
- cepolina.com has pictures from all over the world.
- amgmedia.com is well known by teachers.
- imagefree.com
 
Be fun and creative!!! ;)

We have some questions (for our assignment), do you want to be part of our learning process? Here you are...

  1. What adventure did you complete?
  2. What did you learn that was new to you? Please be specific about the skills and knowledge you learned in this adventure.
  3. How will you use these skills in your teaching?
  4. What questions do you still have about this content?
  5. Where will you go from here? How will you get there?

Friday, February 7, 2020

Effective Infographics step by step


What are Infographics? 

Infographics are a visual representation that includes maps, charts, graphs and diagrams that allow simple, complex concepts to be communicated.

Why use infographics?


  • Analysis presentation: helps to better understand the information presented thanks to visual support, schematization, and organization skills.
  • Content resource: a good way to explain content and information of the subject or lesson. 
  • Motivation: Learning becomes more enjoyable and easier 
  • Social media and learning: infographics create greater participation (interaction) in social networks, increasing the visibility of the message in the online environment.
  • We humanize material: content that is more affable and familiar as it is easily understood.
  • We help us remember: we have a tendency to recall more what we see than what we hear.


An example of the use of infographics:


How To Design Visual Aids For Teaching Purposes />

Retrieved from https://elearninginfographics.com/design-visual-aids-for-teaching-purposes/

Infographic design

Be careful with all these factors while designing your infographics:


  1. Be creative: copying graphic ideas from other infographics should be avoided.
  2. Text & Pictures: Graphically, an infographic should be rich avoiding building it with a lot of text.
  3. Color: Effective contrast colors should be used to encourage reading. An outstanding color selection method is color.adobe.com
  4. Fonts: An infographic should have a creative use of fonts and letter sizes. The Dafont.com site contains a wide variety of sources that can be used as a reference.
  5. Icons: An infographic will include basic symbols (icons) in order to communicate properly. The Iconarchive.com site has very good material.


Tools for making infographics

The main free tools for creating infographic elements:

- PiktoChart is a web tool that allows you to create beautiful infographics from a few models and artifacts that are added with a quick drag and drop. It allows you to customize colors and fonts in just a click, being very easy to use. The free option is a bit limited but it allows you to make easy infographics.

How To Create a Piktochart Infographic Easily

- Canva is a software tool that allows people who are not designers to design and create images for the Web. It has free templates to develop infographics easily.


How To Create Infographics (The Ultra-Simple & Easy Way)

Sunday, February 2, 2020

Mindmaps

Why use mind maps?

To get the most efficient and full research cycle possible, you can surround yourself with the best network advantages of the online educational tools. One of the most useful, certainly, are mind maps, with which you can easily create visually appealing schemes that will stimulate your imagination. You will receive the following benefits in the study with this resource:
  • Link various syllabus concepts and research areas 
  • Organize your tasks or study lessons on different subjects
  • Bring the content you need to learn into perspective
By making a mind map you can link and envision ideas to help you understand the study agenda more easily. And the best thing is that you can use this tool for free and at no expense whatsoever. Check it out and you'll see how the research process gets enhanced when you have good fingertip training material.
I tried to organize my ideas of my research on social media and family involvement:

https://www.mindmeister.com/1410020405/social-media-and-low-ses-latino-family-involvement-in-early-childhood-education-1
What do you think?
I think that it helps you organize your ideas. I really like the option of the presentation. There are different options to share with your team or just share a link for others to see it.

Intuitive and simple.         
                                                                                     

To design and create a mind map with mindmeister is so easy and intuitive. Just follow some simple steps:
1. Choose which subject you want to discuss and start filling the nodes with the learning concepts.
2. It won't take you more than a couple of minutes to take the entire study material into context and easily connect each idea.
3. Once you have visually captured all the study, you can add some audio-visual support that you will help your students understand the whole lesson efficiently.
Picture

Significant learning and visual support.
If you think about it, you will realize that learning is connecting ideas. There are times, however, that it is complicated to arrange all our thoughts and find a conductor thread among them. In these cases, Mindmeister is perfect for retaining information and organizing the different sections of the topic you need to study. They also manage to enhance your creativity and imagination to unsuspected limits.

As you create your map, you will see how your study material begins to make more sense and become easier than you thought.